Public schools in DC have gained ground on national tests over the last 15 years,
but much of that gain is due to the changing demographic composition of DC's student body. The income and education of parents is one of the primary determinants of student performance, and as DC residents have gotten better-off, so have incoming students' scores. Comparing NAEP scores over time without accounting
for incoming class scores is mere jackaNAEPery, and comparing proficiency levels is no better.
The best measure of school quality is how much students learn: their improvement from incoming to outgoing scores, not how well they test at just one point in time.
Measuring how much students learn over time is difficult, and both teacher impact evaluations and school-specific test score growth measures compare only how well students in DC
public schools do relative to other students in DC public schools. This leads to relative rankings only, not measures of how DC public schools as a whole are improving.
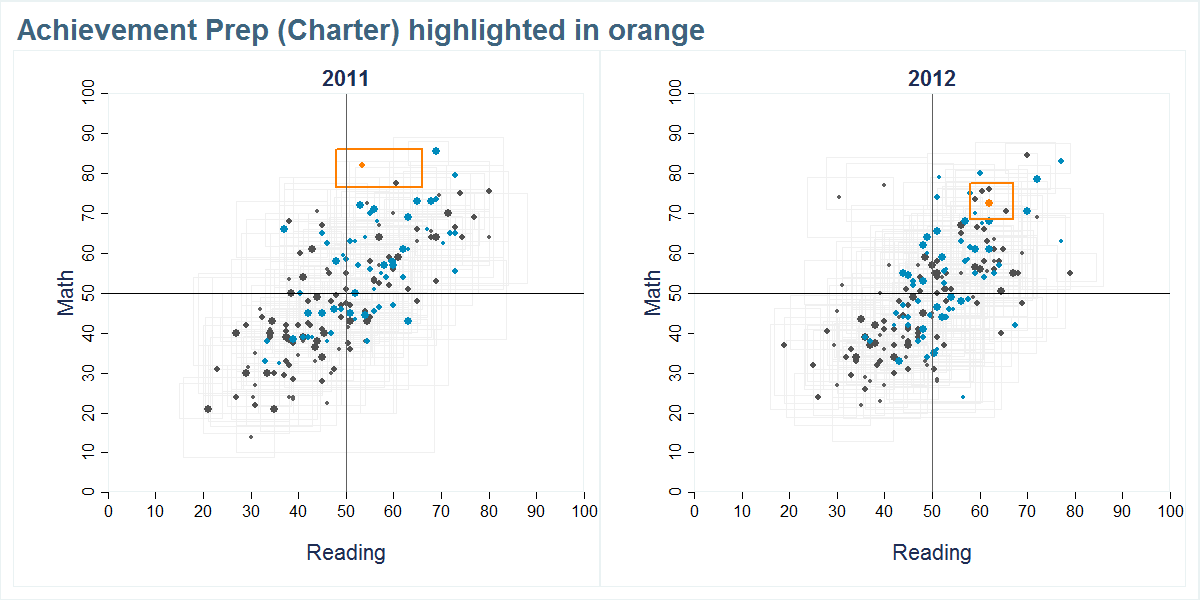
The median growth percentile (MGP) can give us an idea of how much a given school improves students' scores relative to other schools (relativism is characteristic of other measures of value added by schools as well). Each student's growth percentile score is equal to the percentage of comparable students district-wide who performed worse on a later math and reading exam. The school's score is then the typical student's score.
The main problem is that these scores are fraught with measurement error, so rarely can we say with confidence that one school is better than another school. For example, Bancroft was in the top third on math MGP for 2011-12 and H.D. Cooke was in the bottom third, but the two math MGP scores are statistically indistinguishable (the margins of error overlap).
The graph below shows each school's math versus reading MGP scores for 2011 and 2012. A box around each dot indicates the range of statistically indistinguishable values for both math and reading in that year (2013 data were not released with the ranges). This way, we can compare the score both to other schools and to the typical school with a score of 50 (whose dot would be at the intersection of the math and reading lines at 50). Each school's box overlaps with the boxes of many other schools, and any two schools whose boxes touch are statistically indistinguishable. Whenever we compare schools, we should remain appropriately skeptical about the relative strengths of signal and noise in these data.
So what can we say? Charter schools (in blue) tend to have higher growth scores, but traditional public schools are overrepresented at both the highest and lowest ranks. The main difference between the sectors is that charters tend not
to be observed among the lowest performing schools, suggesting that the worst charters are better than the worst traditional public schools.
But there are surprises in both sectors. For example, what is the best high school in town? Ranked by the MGP for math, it is Thurgood Marshall Academy
(Charter), east of the Anacostia, with McKinley Technical High School (DCPS) in Eckington running
a close second. Only a handful of other high schools are statistically better than average on math in both years, but the sought-after high schools Woodrow Wilson and School Without Walls are not on that list.
Among elementary schools, the top performers are scattered around the city, for example Ross in Dupont, Stanton in far Southeast DC, Tubman in Columbia Heights, Watkins on Capitol Hill, and Stoddert in Glover Park.
The top middle schools are the KIPP DC AIM and KEY Academies, with Cesar Chavez Prep and D.C. Prep Edgewood Middle charters not far behind. The highly regarded Deal Middle School barely squeaks out a statistical advantage over the typical school.